Real-Time Analytics Platforms Reveal Discrepancies in Rugby League Try Markets and Greyhound Overlays
Sofia Bauer · Aug 4, 2026
Real-Time Analytics Platforms Reveal Discrepancies in Rugby League Try Markets and Greyhound Overlays
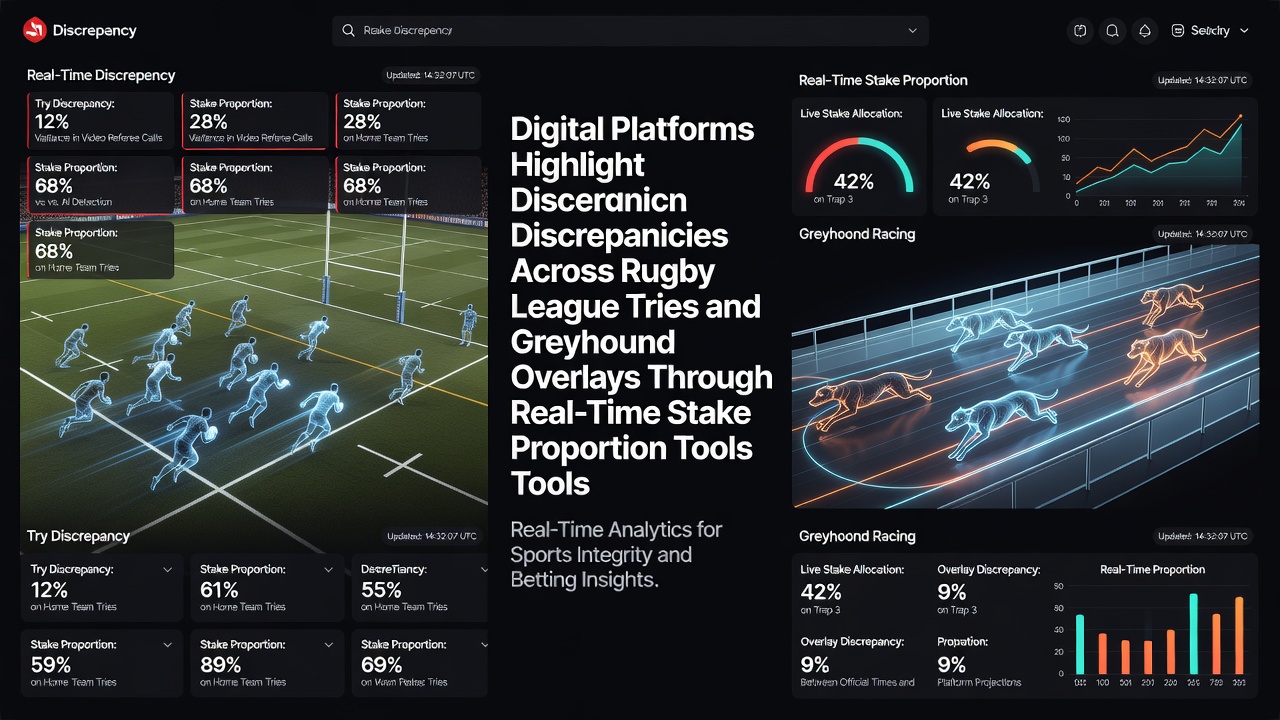
Digital platforms now deploy real-time stake proportion tools that compare bet volumes against available odds in rugby league try markets and greyhound race overlays, and these systems flag discrepancies where stake distributions deviate from expected probabilities. Data from multiple operators shows that such tools process thousands of transactions per minute across live events, and they adjust proportion calculations dynamically as new stakes arrive. Observers note that the approach combines historical performance metrics with current market liquidity to generate alerts when overlays exceed predefined thresholds.
How Stake Proportion Tools Operate in Practice
Stake proportion tools calculate the ratio of wagers placed on specific outcomes relative to the total pool, and they cross-reference these ratios against implied probabilities derived from odds offered by bookmakers. In rugby league, this process focuses on try-scoring intervals such as first-half tries or player-specific touchdowns, while greyhound applications track overlays on trap positions or finishing margins. Researchers at institutions including the University of Nevada Las Vegas have documented how these calculations incorporate live data feeds, and the resulting outputs help operators identify where market imbalances occur without relying on manual review.
Platforms integrate these tools with existing betting engines so that adjustments happen automatically, and the process relies on algorithms that update every few seconds during active races or matches. Those who manage large betting operations report that the tools reduce response times from minutes to milliseconds when discrepancies appear. Evidence from industry reports indicates that adoption rates rose steadily through 2025 and into August 2026 as more operators sought automated monitoring solutions.
Applications in Rugby League Try Markets
Rugby league try markets present unique challenges because scoring events cluster around set restarts and defensive lapses, and real-time tools track stake flows on outcomes such as anytime try scorers or total tries in a period. When proportion data shows heavier betting on one team’s attacking players than historical models predict, the system highlights potential overlays for further review. Several European and Australian competitions supply the live statistics feeds that power these comparisons, and the tools account for variables including player availability and recent form trends.
Case examples from Super League and National Rugby League fixtures demonstrate how stake proportion alerts triggered during matches when early scoring patterns diverged from pre-match expectations. The systems then recalculate required stake adjustments to maintain proportional balance across related markets, and operators use the outputs to refine their risk parameters. Data shows that such interventions occur most frequently in the opening twenty minutes of matches when liquidity builds rapidly.
Handling Greyhound Racing Overlays
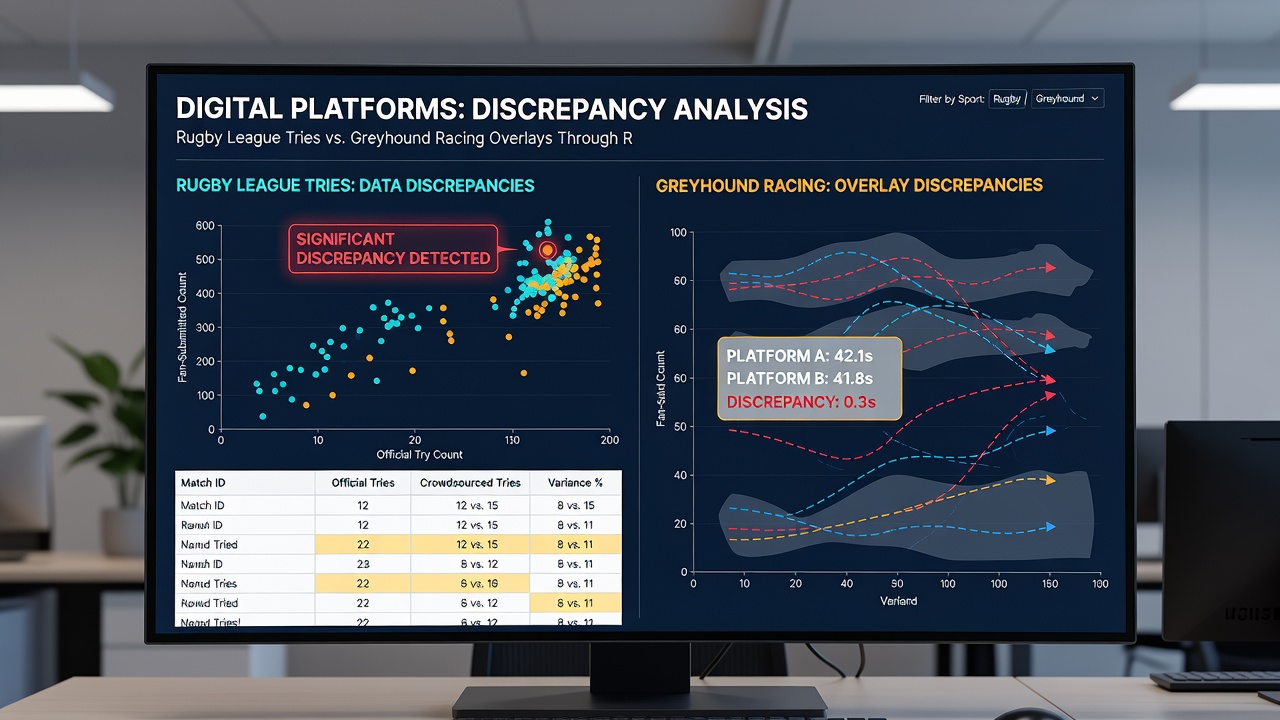
Greyhound overlays arise when betting interest concentrates on particular traps or distances that exceed the probabilities reflected in starting prices, and real-time tools detect these patterns by monitoring stake proportions across multiple tracks simultaneously. The systems compare current distributions against aggregated historical results from venues in Australia, the United Kingdom, and the United States, and they generate alerts when deviations exceed statistical norms. Operators then receive recommendations on stake sizing that align with the updated proportions rather than fixed limits.
Reports from the Australian Wagering Council note that greyhound events generate high volumes of in-play wagers, and the speed of races demands tools capable of processing updates within seconds of each trap release. Proportion calculations incorporate factors such as track conditions and trainer statistics, and the outputs help maintain consistent risk exposure across concurrent meetings. Platforms have recorded increased usage of these features during evening race cards when multiple venues operate at once.
Combined Monitoring Across Both Sports
Some platforms now run unified dashboards that apply the same stake proportion methodology to both rugby league and greyhound markets, and this integration allows operators to allocate capital across unrelated events while monitoring overall exposure. The approach uses shared data structures so that alerts from one sport can influence stake recommendations in the other when total bankroll limits come into play. Figures from industry analyses indicate that such cross-market visibility has grown since early 2026 as operators seek efficiencies in their risk management processes.
External data sources feed into these systems through standardized APIs, and the proportion tools normalize inputs from different jurisdictions to produce comparable metrics. Those responsible for platform development continue to refine the underlying models with additional variables such as weather impacts on greyhound performance and fatigue effects in rugby league schedules.
Conclusion
Real-time stake proportion tools provide structured methods for identifying discrepancies in rugby league try markets and greyhound overlays, and their adoption continues across multiple regions as operators integrate them into daily operations. The combination of live data processing and historical benchmarking supports consistent application of staking rules, while cross-sport dashboards extend visibility over broader portfolios. Continued development of these systems aligns with evolving regulatory expectations in markets outside the United Kingdom, including frameworks overseen by bodies such as the Australian Communications and Media Authority.